Attribution: How to attribute?
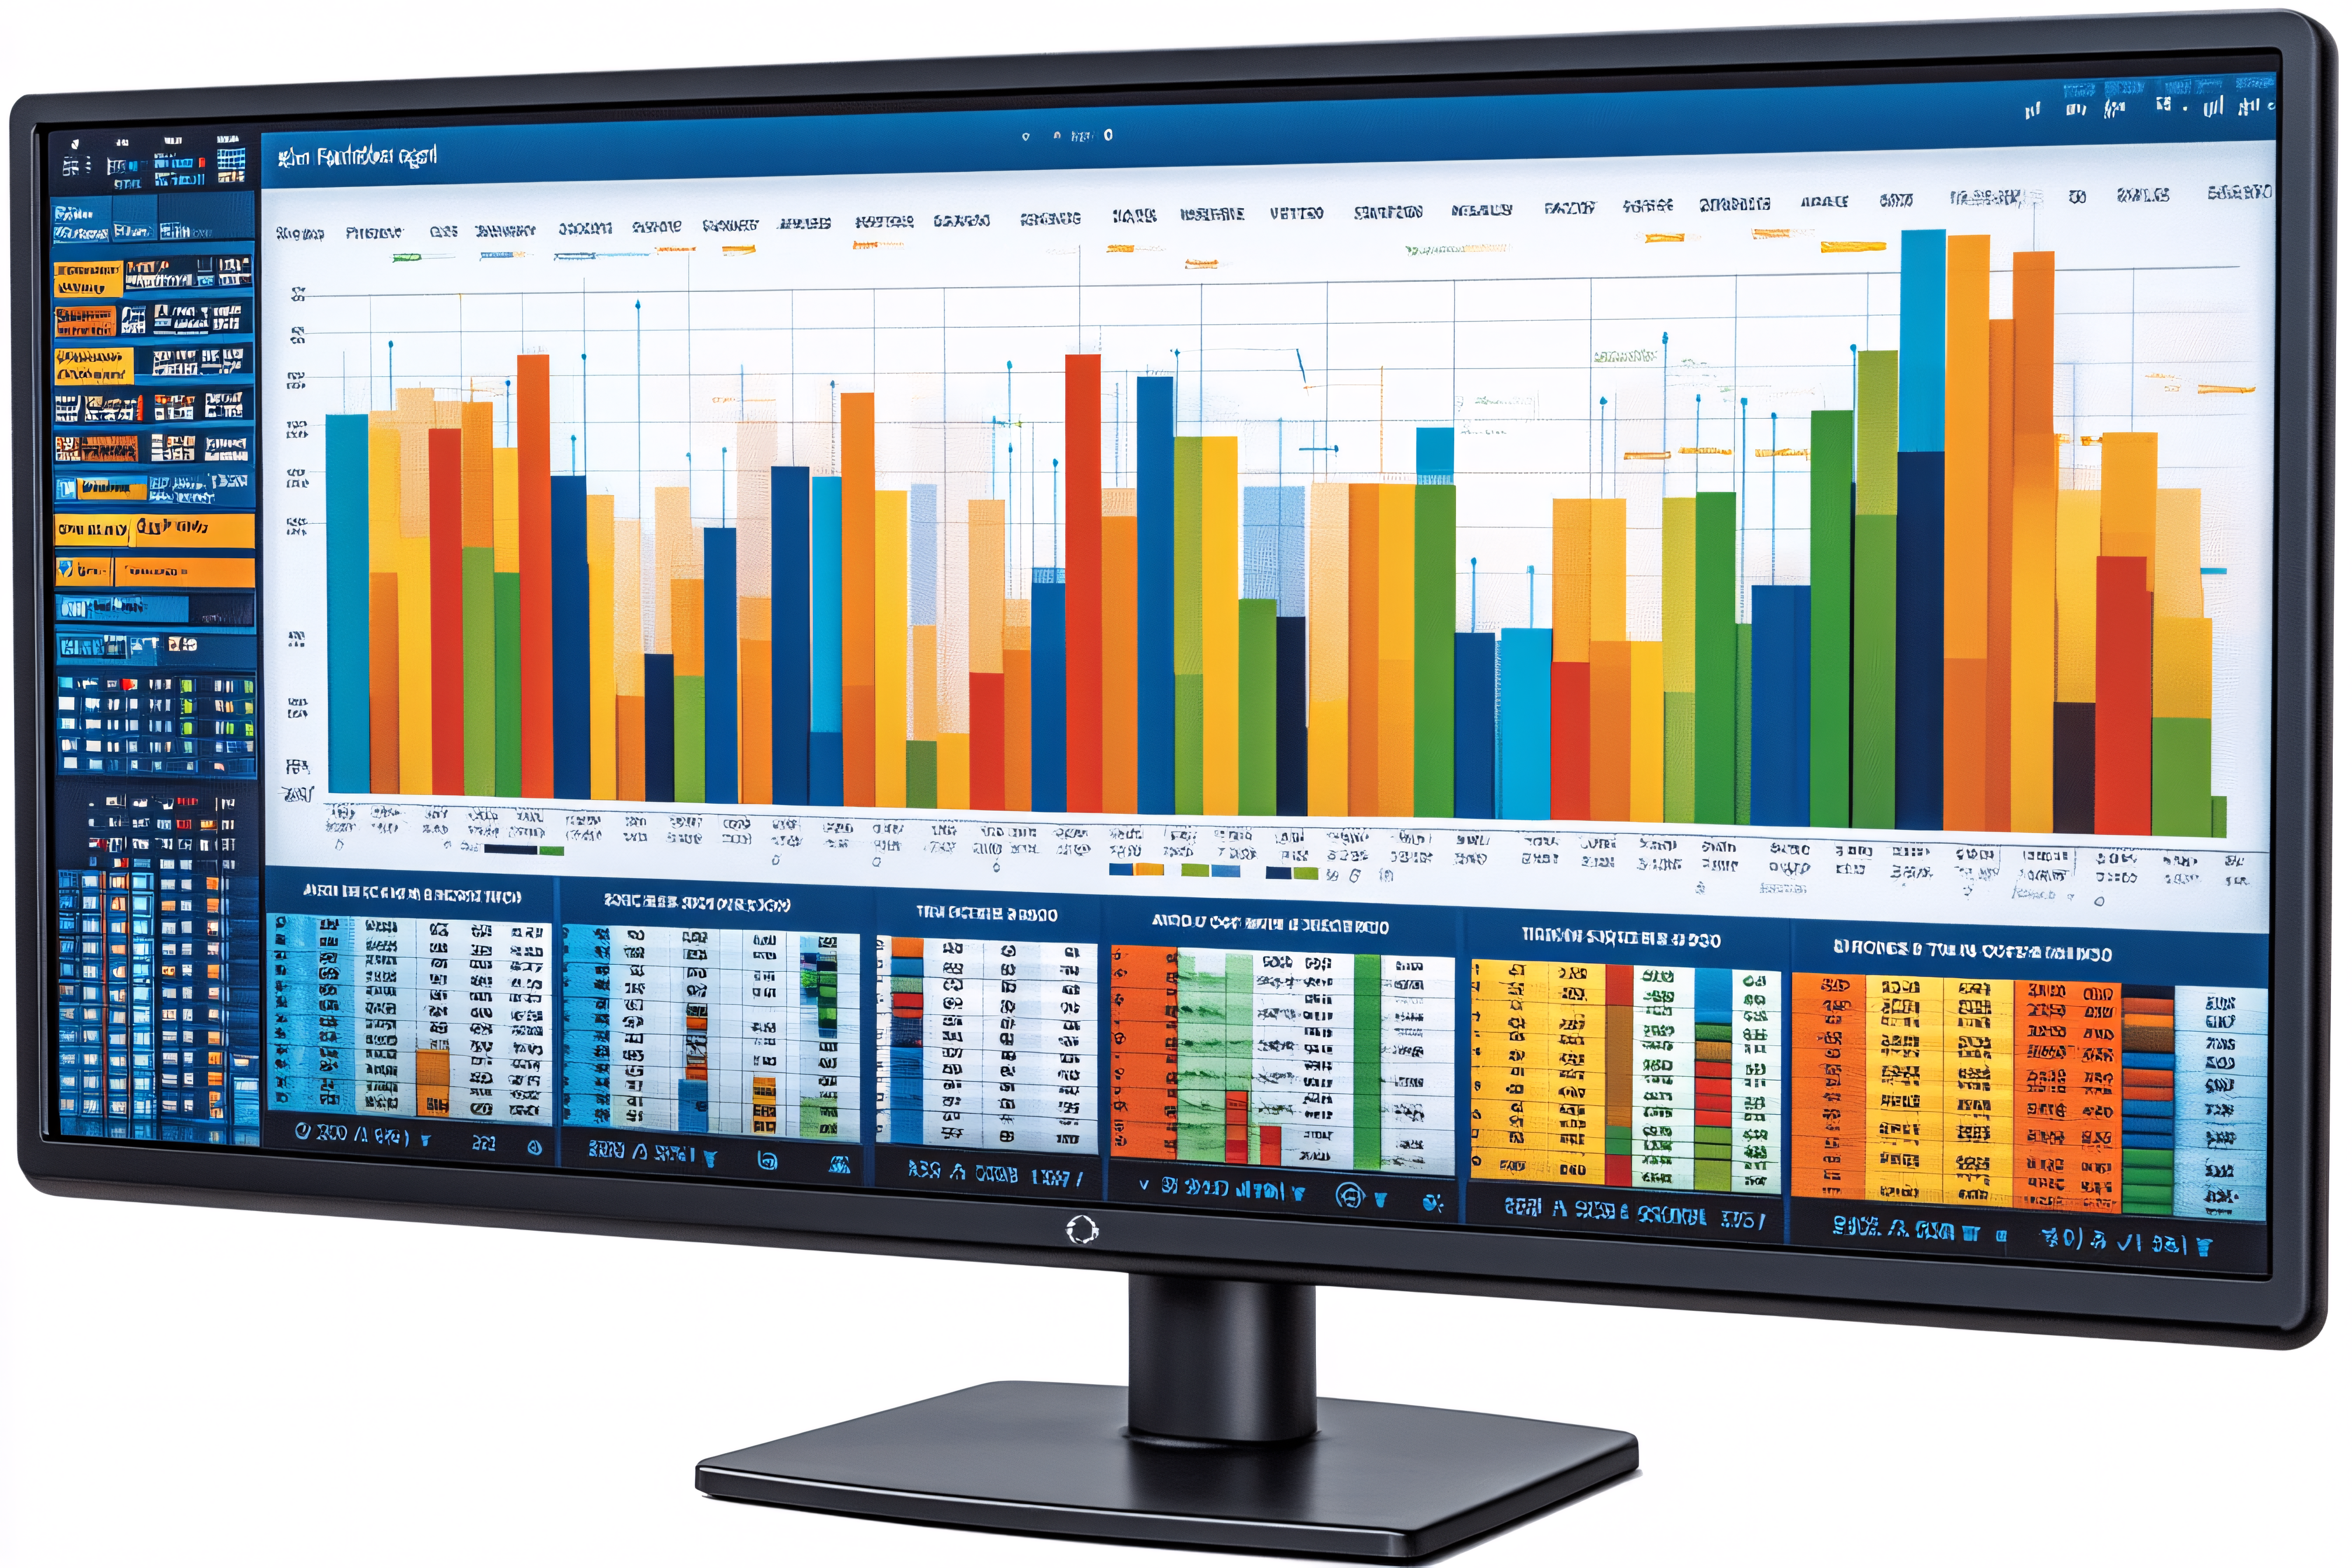
This digital artwork showcases a modern monitor displaying a comprehensive array of financial data. The screen is filled with various charts, graphs, and tables, predominantly using blue and orange color palettes, indicative of financial performance or market trends. The detailed visual representation suggests a sophisticated financial analysis application or trading platform. Usage suggestions include illustrating articles about financial technology, stock market analysis, or data visualization in finance. It can also be used as a visual element in presentations or reports concerning investment strategies or financial performance.